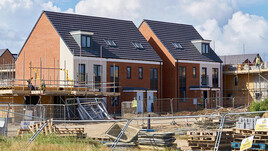
The New Build Market Review shows the overall, top level status of the New Build property market for the last decade, to the end of Dec 2017.
Transaction Volumes
The volume of *transactions following the 2009 housing market crash was impaired for several years but in recent years levels are now beginning to exceed pre-2009 volumes. (*A New Build transaction for reporting purposes is defined as a completed, full-price property sale). The volume of transactions for June exceeded that of preceding months and this made June the best month in 2017 to date. However, trend did not continue for much of the remainder of the 2017. However, there was a rebound in Dec 2017. Overall there has been a slow but steady increase in the number of transactions since ~2010.

Market Value
Following the 2009 housing market crash house prices recovered and the overall monthly value of the market at December 2017 was almost double the value of the market in 2007. (In the graph below the total value of all transactions are listed by month from Jan 2007 to the close of Dec 2017. Units are in billions.) The market value for June 2017 exceeded that of preceding months making June 2017 the best month in the last decade.

When the total annual value of the market is viewed by year from 2007 to 2017 there was a reduced rate of increase in 2017. This may however be due to late reporting or processing of sales.

Year by year regional results
Regionally there have been consistent price increases in all areas when all property types other than flats are considered. London has seen year on volatility.

On a regional basis London and the South East have led the way in terms of the number of post-recovery transactions recorded on a year by year basis. (The graph below shows values from 2007 to 2017). In 2017 the South East out performed London.

When the value of all transactions by region is considered London has outperformed all other regions, with an overall value in 2017 just in excess of £10 billion. The value of transactions for London was slightly reduced when compared with 2017. All other regions saw slight increases.

Average property prices by type of property, by month
Average property prices for each major type of property (houses, semi-detached houses, terraced houses and flats) have all showed consistent increases since 2009 and the trend seems likely to continue. There has been a slightly reduced rate of increase for all types, perhaps with the exception of flats.


The Consumer Price Index for 2008-2018 as an indicator of underlying inflation levels is shown below:

Data for the above has been obtained from official Government sources.


