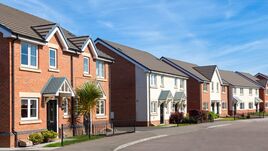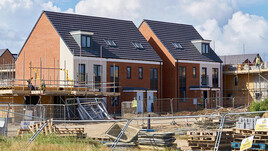
In the year to end September 2018 new build house prices rose on average by 4.7% across the UK which is down on last year’s figure of 9.8%
The New Build Property Market
The Ministry of Housing, Communities and Local Government has recently published its analysis of house building activity to the end of the June quarter 2018, in England. On a quarterly basis starts were down 4% on the previous quarter and down 4% on the same period a year earlier. Seasonally adjusted starts were 38,730. Seasonally adjusted completions were 40,550, which is 7% higher than the previous quarter and 1% higher than a year ago.
In the year to end June 2018 annual starts stood at 160,020, 3% down on the same period last year. Completions, which stood at 161,240, were 5% higher than the same period last year. Fewer starts and more completions indicates a contraction in the available stock of new build homes. So the amount of new build in the market place is being reduced, which is hardly surprising given the level of economic and political uncertainty.
The LSL Land & New Homes New Build Quarterly Review blog analyses data the overall new build market between 2007 and the end of March 2018. The data shows an industry where the value of recorded sales has recently peaked at around £3 billion per month with sales volumes have reached approaching 9,000 per month. But in line with the above data, both of these measures of output are now starting to tail off as the industry becomes increasingly cautious...
Continued in the full report - please click below to open...
Click here to read our full report

The North / South divide excluding Greater London can be seen below:

Click here to view an interactive price-change map
Click here to explore historical house sale prices
Click here for the New Build Index archive


