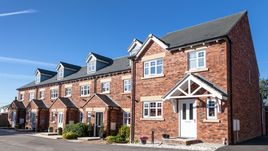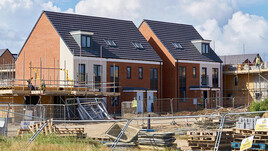
In the year to end Oct 2018 new build house prices rose on average by 3.7% across the UK which is down on last year’s figure of 9.5%
The New Build Property Market
The latest Halifax data has recorded a 1.5% year on year growth in house prices on the same quarter a year since. They say that this is the lowest rate of growth that they have recorded since March 2013. This annual growth rate is very much in line with Nationwide data which records a 1.6% year on year increase. The Hometrack UK Cities House Price Index reports an average year on year growth rate of 3.4% amongst the UK’s cities. Birmingham and Liverpool are recording the strongest growth, at over 6%, followed by a range of other cities spread across the UK which are recording healthy 4% plus rates of growth.
The RICS has recently reported that it is now taking an average of 19 weeks to complete a property search which is the longest time since it started collecting data on this. It also puts the blame for market uncertainty squarely onto Brexit, highlighting downwards price pressure on London which is now spreading into the South East and East Anglia. The RICS reports across-the-board issues rising from Brexit, with falls in the number of properties coming to market, as well as in buyer enquiries and prices. However, away from the South, the Brexit effect is less marked and price rises are being reported in the West Midlands and Scotland, with Northern Ireland being reported as having the most robust housing market in the UK. However, this could well be because the North/South market ‘catch up’ is outweighing the Brexit effect.
LSL Land & New Homes’ analysis of National property sales data tracks New Build transaction volumes, market value and average selling prices across a range of measures. The chart ‘Transaction volumes over time to the end of April 2018’ highlights the fall-off of new build sales volumes from 2007 through to 2011. A steady rise in monthly transaction volumes then started and this appears to have peaked around mid 2017 at near to 9000 transactions per month (certain transaction types are not included in this data). In line with other market data, it now appears as if the peak has passed and the market is beginning to slow. But of course, the nature and length of this downturn is likely to be determined by the outcome of Brexit. The chart showing ‘Average purchase price for detached properties Jan 2007 to end April 2017’ tells a slightly different story. Detached houses tend to be built in areas of lower density housing which tend to be further away from cities, and generally speaking are located away from Central London and the more crowded South East. So it is perhaps unsurprising to see a fairly gentle price fall following the 2008 crash, followed by a period of stagnation and then a slow but long lasting recovery. Overall prices are not dramatically higher than they were a decade since, particularly when wage growth is taken into account...
Continued in the full report - please click below to open...
Click here to read our full report

The North / South divide excluding Greater London can be seen below:

Click here to view an interactive price-change map
Click here to explore historical house sale prices
Click here for the New Build Index archive


