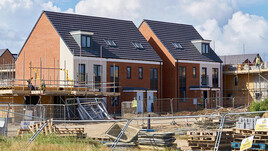
In the year to end April 2019 new build prices per m² rose by an average of 3.8% across the UK…
The New Build Property Market
LSL / Acadata’s April House Price Index reports house price growth down by –0.1% on the same month last year For England & Wales, with average house prices standing at £302,122 (see graph to right). The Nationwide’s April 2019 House Price Index reports UK wide house price growth up 0.9% on the same month last year, with average price now standing at £214,920. The report talks of a stable situation, albeit with weakening buyer sentiment. The report also points to the steady rise in First Time Buyers, which doesn’t show any signs of abating and which will be helping to underpin the market as FTB’s often create buyer chains. The main reason cited that stops more FTB’s entering the market is difficulty in raising the deposit. The report finds that, when compared with historic data, low interest rates offset the relatively high property prices, so keeping affordability pretty much in line with historic levels.
The NAEA (National Association of Estate Agents), reports in its March 2019 Housing Report that the supply of available properties to buy stood at 37 per branch which was the lowest level that it had recorded for the month of March. This represented a year on year fall of 8%. The report also finds that 81% of properties sold for less than the original asking price.
The ONS UK Property Transaction Statistics for March 2019 is a monthly estimate of the number of residential property transactions in the UK. The count for March 2019 was 101,830 which is nearly 7% higher than the figure for March 2018, which is of course positive news in the present uncertain environment. But that said, the report shows that transaction volumes have been relatively stable over the past ten years and the only recent ‘blip’ of significance was in 2016, when higher stand duty rates were introduced for the purchase of second properties...
Continued in the full report - please click below to open...
Click here to read our full report

The North / South divide excluding Greater London can be seen below:

Click here to explore historical house sale prices
Click here for the New Build Index archive


