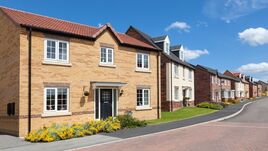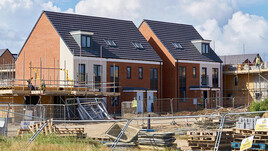
In the year to end May 2019 new build prices per m² rose by an average of 3.73% across the UK...
The New Build Property Market
The Office for National Statistics (ONS) Regional House Price data has been examined to find the high point in terms of average selling prices in each region at the time of the last peak which was between 2007 and 2008. The most recently available data for this index is March 2019 and this is taken for the ‘Latest average price’ column. A comparison of the ‘2007 to 08 peak’ and ‘Latest average price’ columns allows us to generate the third column which shows the percentage change from the peak to the present day in each region.
Over the period in question London has seen residential property price growth of over 50% whilst the East and South East have seen price growth at or slight over 33%. As the wave moves out from London we get to the East and West Midlands and the South West, which have experienced growth of around 20% over the period. Moving further from London, the North West and Yorkshire & the Humber have seen price growth of between 5 and 10% over this past decade, and the North East has seen price falls of over 10%.
The above price changes are in nominal terms, which means that that the effect of inflation is not accounted for. Over the period in question, inflation and earnings growth have contributed to reduce the value of property in real terms. Also, the Bank of England base rate fell to 0.5% just after the peak and has remained little changed since then, which makes mortgages more affordable...
Continued in the full report - please click below to open...
Click here to read our full report

The North / South divide excluding Greater London can be seen below:

Click here to explore historical house sale prices
Click here for the New Build Index archive
LSL market intelligence indices and reports


