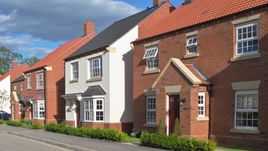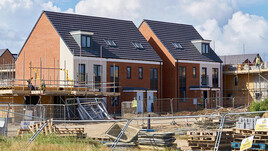
In the year to end June 2018 new build house prices rose on average by 5.2% across the UK which is down on last year’s figure of 11.0%
The New Build Property Market
The ONS UK House Price Index by Country tracks average house price changes between 2005 and present day and is shown in the chart below. It clearly shows the dramatic boom in the Northern Ireland market of 2006/7 followed by the crash of 2008 and general decline in the years to 2012/13. England, strongly weighted by the ‘London effect’, was in recovery by 2009 whereas Wales and Scotland saw a drop in 2009 followed by a levelling out and what has now become a steady but undramatic recovery.
Prices in Northern Ireland remain well below the peak that they achieved over a decade since but the other countries are all now achieving average prices above the last peak.
In the year to April 2018 house prices in England rose by an average of 3.7% and now average £244,000 according to this index. Over the same period house prices in Wales rose by 4.4% and now stand at £156,000. Northern Ireland has recovered steadily since its low point in 2013 and at the end of Q1 (Jan to March 2018) the year on year growth was 4.2% and average prices stood at £130,000. The best performing country was Scotland where the average sale price rose by a healthy 5.6% over the year, taking the average price to £149,000.
The most recent Residential Development Land update from Knight Frank compares price changes for development land across various types and geographies.
It found that English greenfield land values rose by an average of 2.2% over the year to Q1 2018, having risen by 0.9% on the previous quarter. Urban brownfield land values rose more strongly showing year on year growth of 6.4%. Prime Central London land values declined by 2.1% over the period....
Continued in the full report - please click below to open...
Click here to read our full report

The North / South divide excluding Greater London can be seen below:

Click here to view an interactive price-change map
Click here to explore historical house sale prices
Click here for the New Build Index archive


North / South divide and cost per square meter results are based on data from eSurv.


