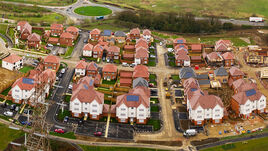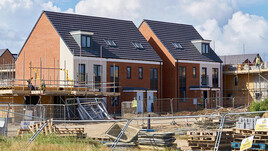
In the year to end January 2020 new build prices per m² rose by an average of 2.19% across the UK...
The New Build Property Market
The latest house price data from the Office for National Statistics finds that average UK house prices are up 2.2% over the year to December 2019, and up from a figure of 1.7% in the year to November. England, Scotland and Wales saw a price rise of 2.2% over the year and Northern Ireland saw a rise of 2.5%.
In England, at a regional level, all regions experienced price rises, the first time that this has happened since February 2018. The data runs off completed sales so it will reflect a pickup in activity towards the back end of 2019 as opposed to a post-election boost, although this effect may now be occurring too.
Looking over the past two decades, house price growth across the UK peaked at 10% around June 2007 before falling to -15% around February 2009. In the years since August 2016, year on year growth has been steadily declining, heading from the 5% mark down towards zero. However, over the past few months the trend line appears to have bottomed out and turned upwards and the coming months will confirm if this is a move towards a stronger market...
Continued in the full report - please click below to open...
Click here to read our full report

The North / South divide excluding Greater London can be seen below:

Click here to explore historical house sale prices
Click here for the New Build Index archive
LSL market intelligence indices and reports


