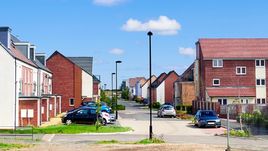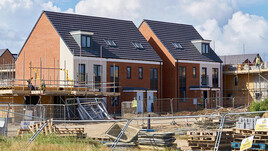
In the year to end July 2018 new build house prices rose on average by 5.4% across the UK which is down on last year’s figure of 10.3%
The New Build Property Market
A recent report from JLL on the prime central London sales and lettings market has found increasing signs of stability. Slight growth in the sub £5 million market was noted, although higher priced properties are continuing to see year-on-year declines in price, albeit at a slowing rate. Prices rose by 0.1% over the quarter, which followed a similar rise in the first quarter. This is the first time that this has happened in more than four years.
Meanwhile in the rental market, Prime Central London rents have declined by 13% over the past two and a half years but have now seen modest rises for the past two quarters. As with the sales market, it is the lower end that is seeing most growth.
From a mortgage market perspective, Moneyfacts reports that the number of Buy to Let mortgages has reached a record high in July 2018 with 1,268 such loans on the market. This represents a 22.6% increase over the past year. The increase is likely to be driven by new providers entering the market and fixed term deals coming to an end on existing buy to let mortgages.
UK Finance has said that gross mortgage lending in June is 2.1% higher than a year earlier, but this figure covers changes within the mortgage market. The number of mortgage approvals by the main high street banks fell year on year for June, by 2.1%, and whilst remortgaging activity was rising there was a 4.7% fall in house purchase approvals. Other analysis by UK Finance shows a growth in market share amongst the challenger and specialist banks.
In terms of the number of properties coming to the market, Rightmove have reported a substantial increase in June. Estate agents now have the highest stock levels since September 2015 according to this measure. Rightmove report an 8.6% increase in the number of homes it is advertising for sale whilst the number of sales is down 0.2%. The combination of an increase in supply and steady demand would be expected to have a cooling effect on prices.
In the case of New Build properties, NHBC data has highlighted a reduction in the number of new build starts in London. In the three months to June 2018, new build starts were 12% down on the same period last year. The figure of 2,917 is less than half the number that were started a year before the 2016 Brexit vote. Housing starts increased in most other regions over this period, but the total figure for all regions fell by 3% because of this London effect.
Regionally, the Hometrack ‘UK Cities House Price Index’ looks at house price data in various cities across the UK. In the year to June the best performing regions have been Northern based with Manchester at 7.4%, Liverpool at 7.2% and Birmingham at 6.8%....
Continued in the full report - please click below to open...
Click here to read our full report

The North / South divide excluding Greater London can be seen below:

Click here to view an interactive price-change map
Click here to explore historical house sale prices
Click here for the New Build Index archive


North / South divide and cost per square meter results are based on data from eSurv.


