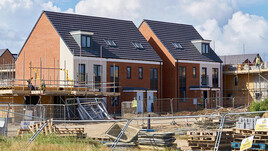
In the year to end March 2018 new build house prices rose on average by 8.6% across the UK which is up on last year’s figure of 5.7%
Political Events
The House of Lords defeat of aspects of the EU Withdrawal Bill continues the uncertainty around Brexit. Brexit related issues (such as a fall in overseas buyers) are being cited as potential causes for a stagnant or falling market around London, but the Government knows that it can’t waiver in its determination.
In a less dramatic way, next month will see the introduction of the GDPR (General Data Protection Regulation) and this will have an impact on the house building industry. Marketing and sales processes will need to have more clarity on how prospect and customer data will be used, as well as the need for clear confirmation action by the prospect at the point of collection. In addition, the use of marketing agencies to carry out mailings and bought-in prospect lists will require verification about the way in which customer data is shared and kept safe. And that only relates to prospects and customers, company employees are also covered.
The New Build Property Market
Acadata and Rightmove have recently reported a continued slowdown in transaction volumes with price falls in Greater London. But against this, prices are rising in the regions, indicating that a long awaited catch up is still underway.
The RICS market index which compares the number of surveyors reporting rises and falls in prices over the past three months has remained at 0%, indicating a balance which continues the five year low point reported last month. As with the Acadata report, the RICS points out that the weakness stems from Greater London and the South east with other regions showing some strength.
The volume of residential transactions seems likely to remain low with the RICS reporting that new sales listings had fallen for the last seven months, with stock levels now being within a whisker of the all time low figure...
Continued in the full report - please click below to open...
Click here to read our full report

The North / South divide excluding Greater London can be seen below:

Click here to view an interactive price-change map


